Analyzing pages in a particular state with Lighthouse
posted on
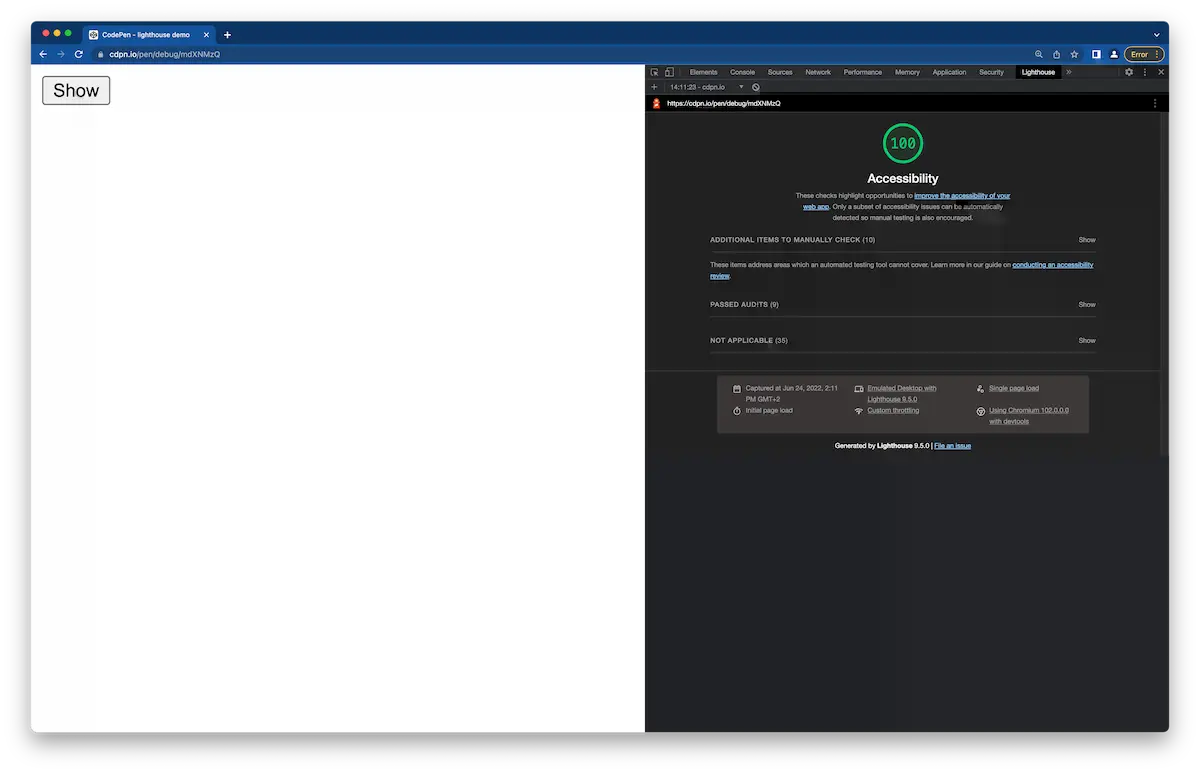
Historically, Lighthouse has analyzed the cold pageload of a page only. Clicking the “Generate report” button reloads the page before Lighthouse runs its tests. This can be problematic when you want to run tests on parts of the UI that are only visible when the user interacts with it. For example, a fly-out navigation, a modal window, or the content in a disclosure widget.
That has changed with Lighthouse v10. A new experimental feature in Chrome DevTools allows us now to analyze the page in a particular state. Here’s an example:
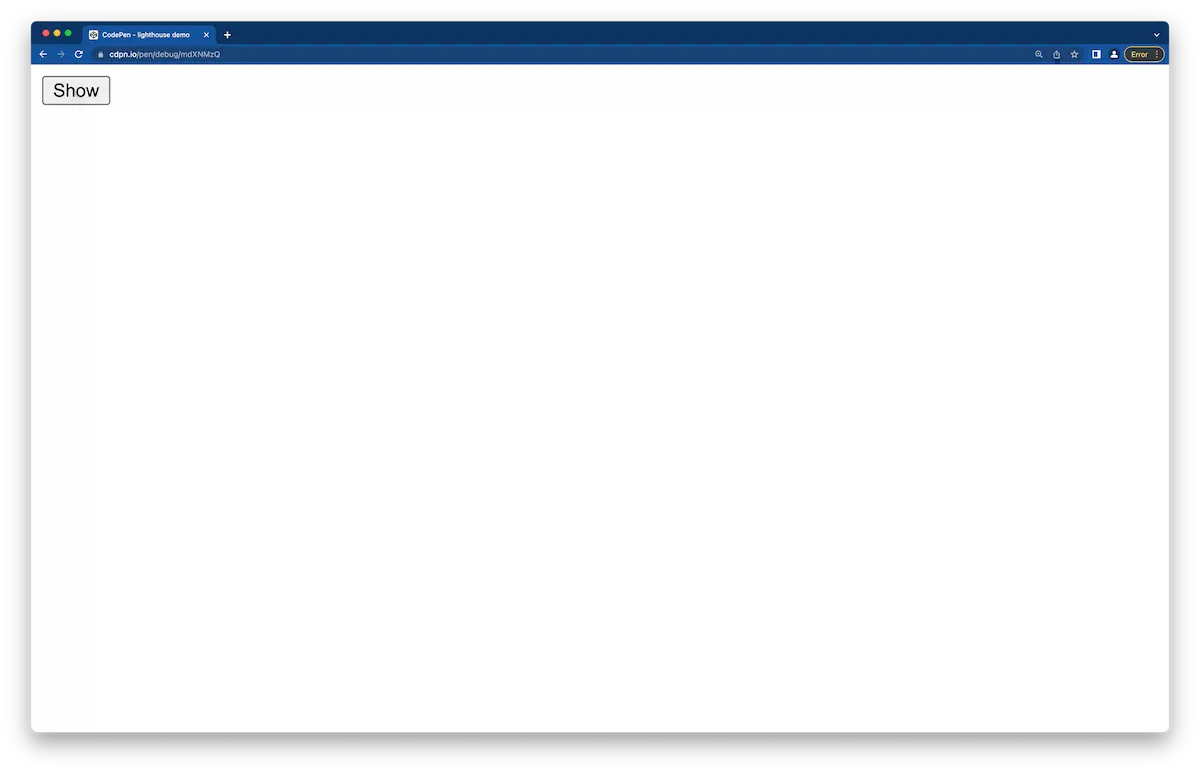
When you click the “Show” button in this simple disclosure widget, an image appears.
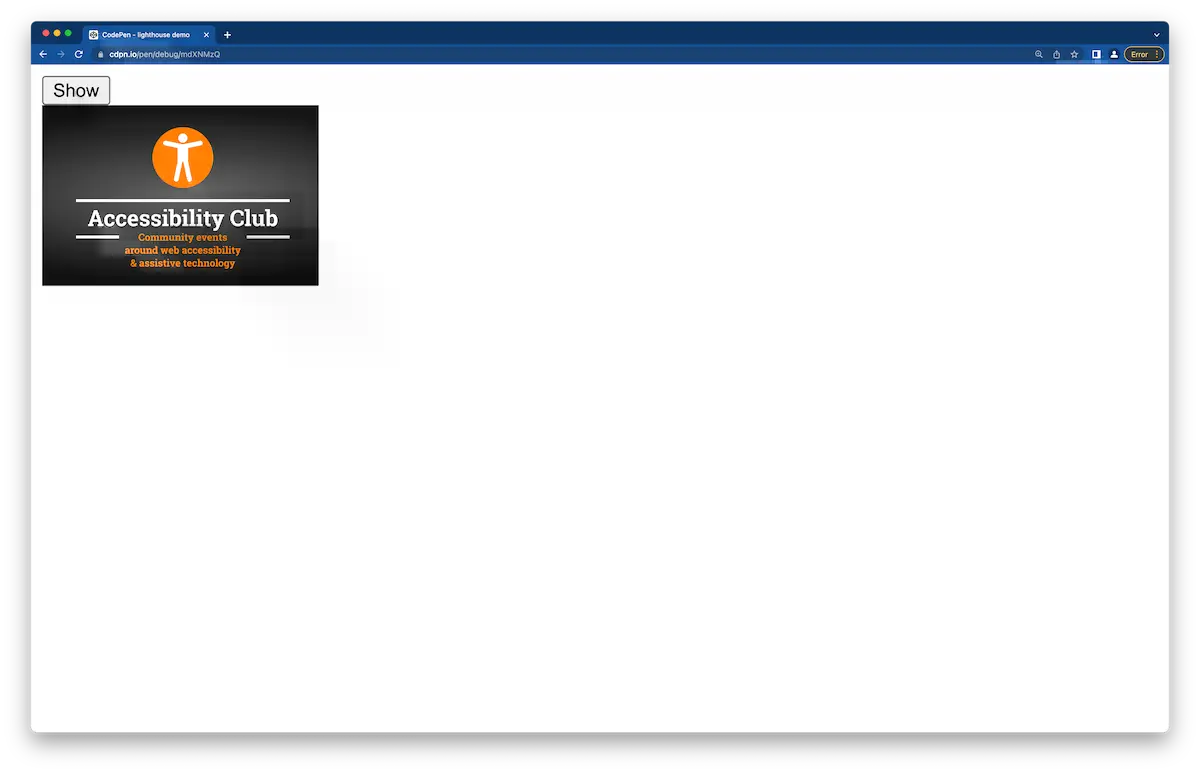
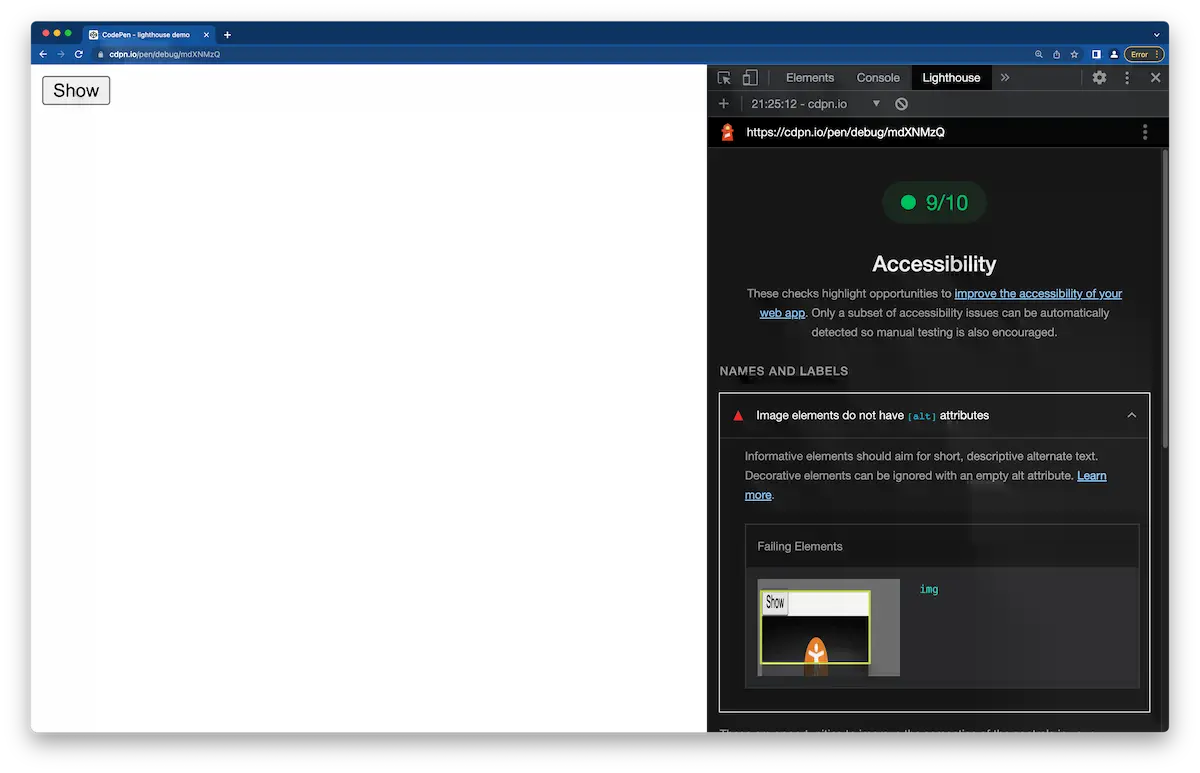
The image has no alt attribute and Lighthouse should report an error, but it reloads the page, and the image is gone when it runs the tests, because the state of the page doesn't persist.
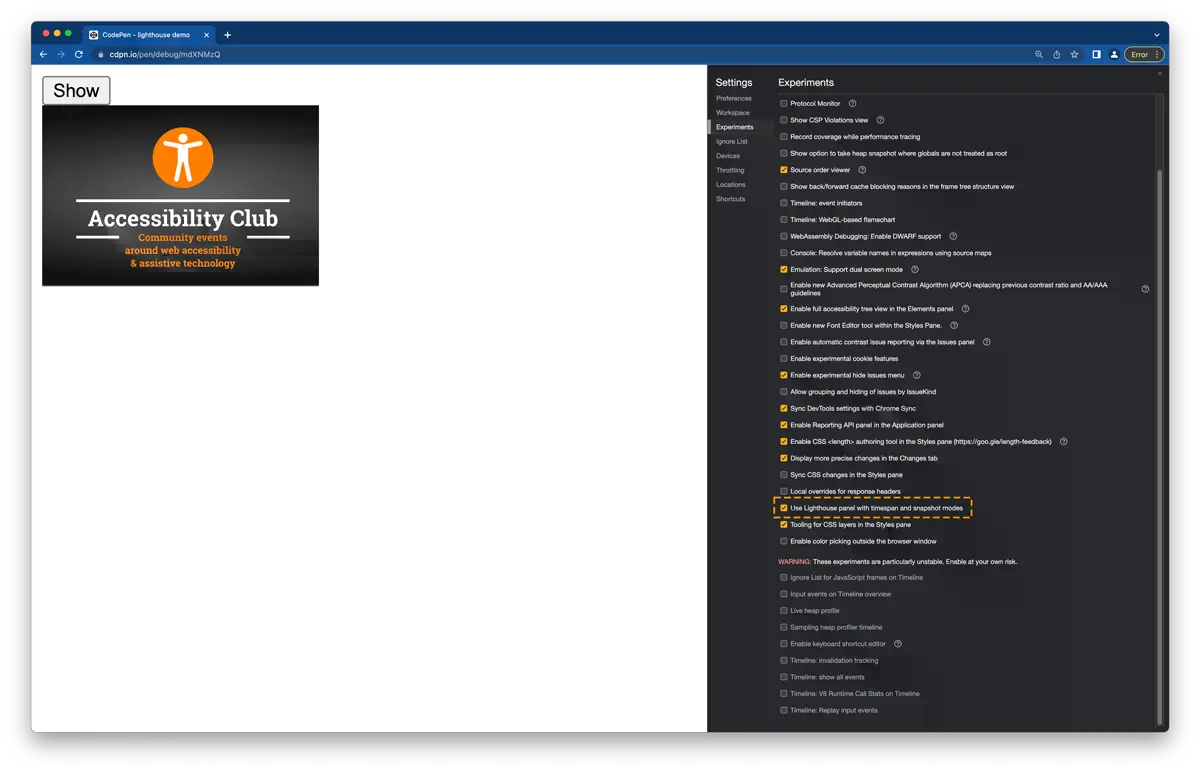
Starting with Lighthouse v10, you can also run tests on snapshots of a page. First, you have to enable this feature because it’s still an experiment: Open Chrome DevTools, press F1, click “Experiments”, and tick the checkbox “Use Lighthouse panel with timespan and snapshot modes”.
Now Reload Chrome DevTools and open Lighthouse again. There’s a new column “Mode”. Select “snapshot” and run another Lighthouse test.
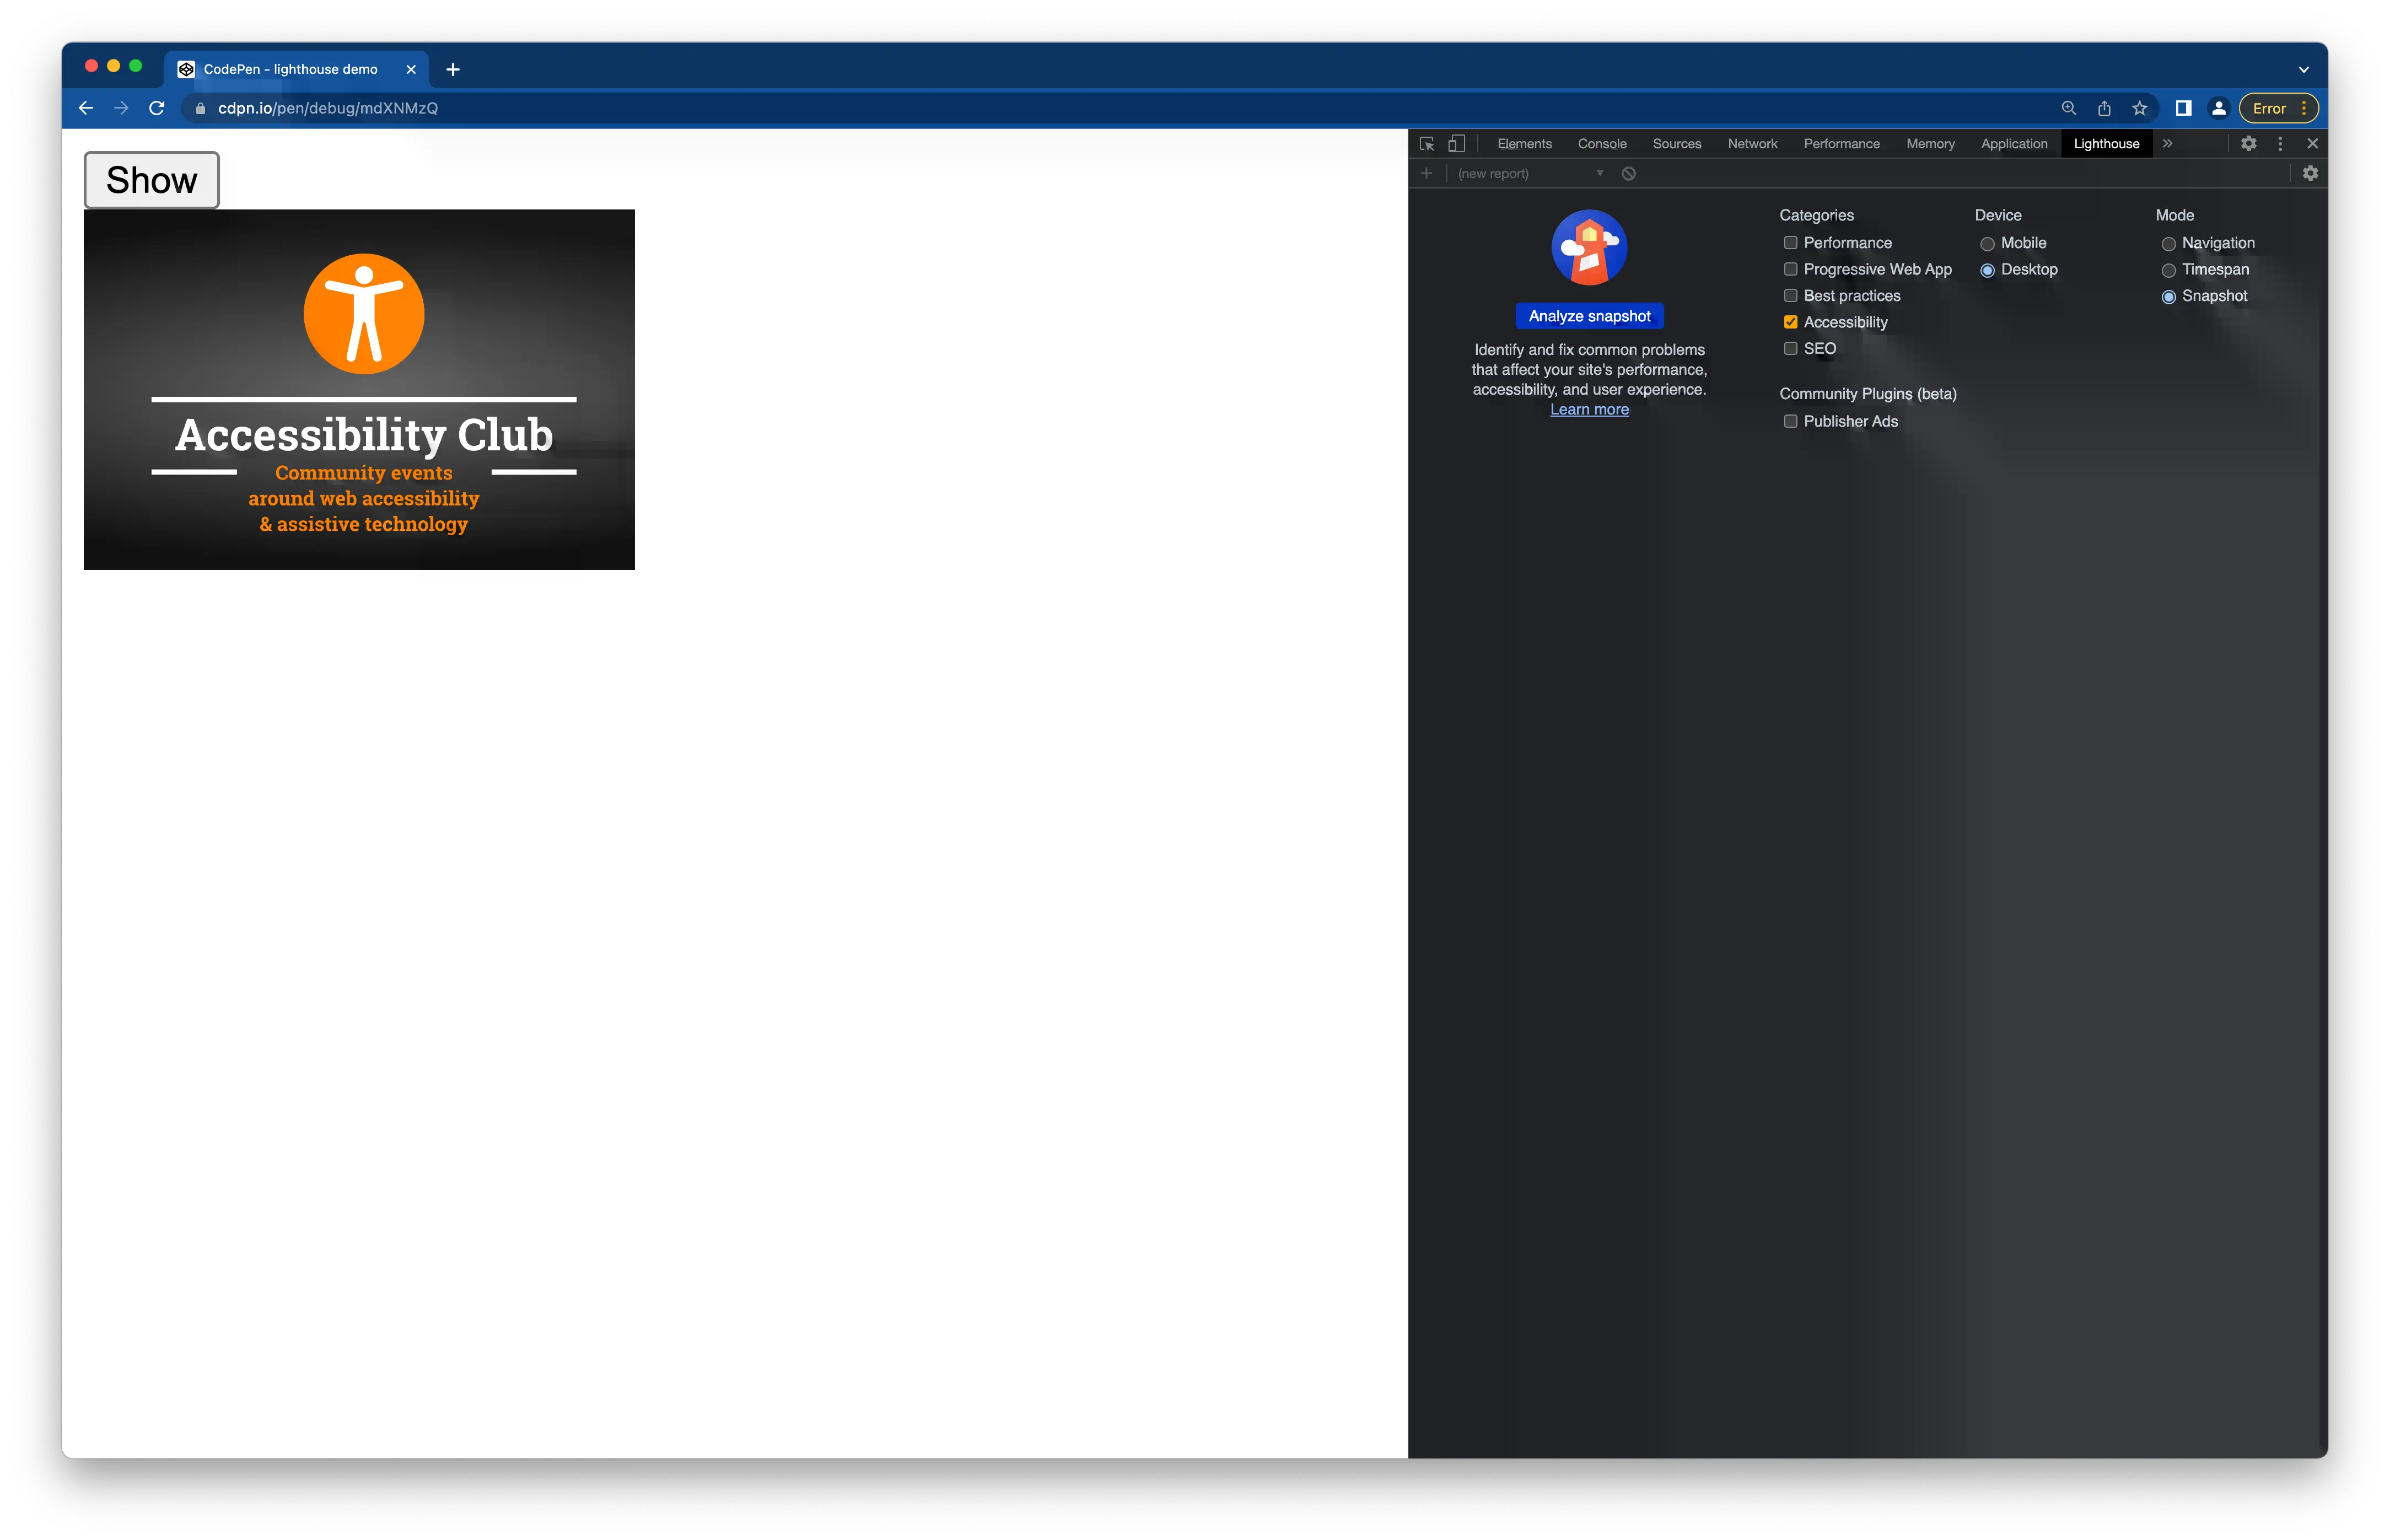
Lighthouse doesn’t reload the page, but it checks it as it is in its current state. Instead of a score, it now shows how many tests of the total number of applicable tests the page has passed.
This is a really useful addition to Lighthouse I always wanted to have. It’s not just useful for accessibility, but for all categories. Thanks a lot to Harry for drawing my attention to this feature in his course “Setting up DevTools for Performance Testing”.